Skip Navigation

Community School Information

About the Community School Assets and Needs Assessment Infographic

The Community School Assets and Needs Assessment Infographic provides an overview of the Assets and Needs Assessment process, findings, and recommended action steps. This infographic clarifies how our data and stakeholder feedback will guide future decisions and actions.

Community School Assets and Needs Assessment Infographics for Templeton Elementary

Templeton Elementary School Demographics and Progress Data
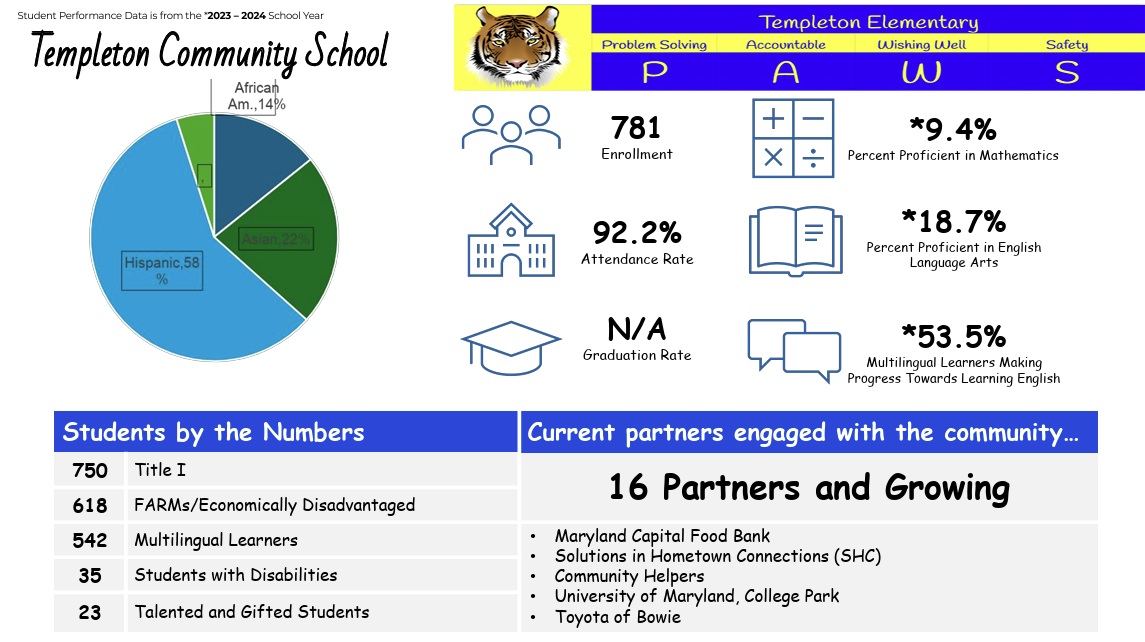
Community-Schools-Infographic-Templeton

School Demographics

Enrollment 781 students

58% Hispanic
22% Asian
14% African-American
6% White

Students by the Numbers

750 Title I
618 FARMs/Economically Disadvantaged
542 Multilingual Learners
35 Students with Disabilities
23 Talented and Gifted Students

Progress Data

92.2% Attendance Rate
9.4% Proficient in Math
18.7% Proficient in English Language Arts
53.5% Multilingual Learners Making Progress Towards Learning English

Current Partners Engage with the Community

16 Partners and Growing
  • Maryland Capital Food Bank
  • Solutions in Hometown Connections (SHC)
  • Community Helpers
  • University of Maryland, College Park
  • Toyota of Bowie

Who participated in our Assets and Needs Assessment?
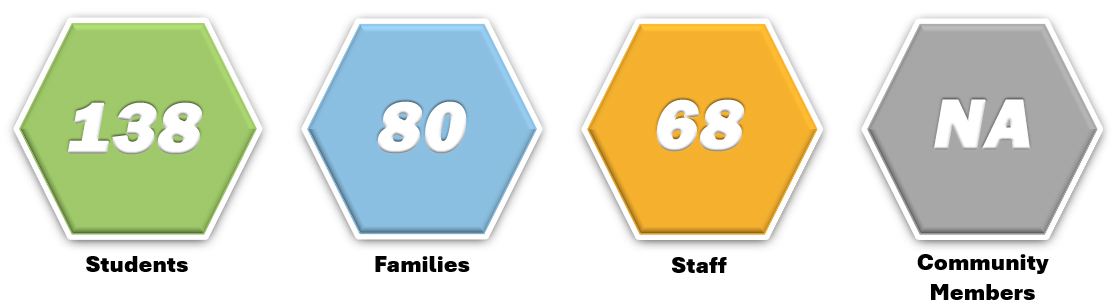
138-students-80-families-68-staff-NA-community-members-on-colorful-hexagons

  • 138 Students
  • 80 Families
  • 68 Staff Memebers
  • NA Community Members

What did we learn?

student-child-with-balloon-icon
Student Feedback
  • Student Supports Needed: Students want peer mediation and a space for reflection or prayer.
  • Unmet Needs: Some students face challenges with mental health, healthcare, food, transportation, and safety.
  • Access Gaps: Many aren’t fully aware of available school support services.
  • Positive Climate: Most students feel safe, welcome, and able to talk to adults. Positive Climate: 83.2% feel welcome; 80.5% can be honest with adults; 74.8% understand school
  • Areas to Improve: Boost cultural inclusion, student voice, and family engagement.  
family-adults-with-children-icon
Family Feedback
  • Strong Academics: Families value TAG, STEM, field trips, and extended learning.
  • Basic Needs: 24% report food insecurity; 18% need transportation; 58% report no unmet needs.
  • Welcoming School: 92% feel welcomed; 85% trust staff; 71% feel supported.
  • Low Leadership Awareness: Only 25% know of a parent group; 65% are unsure.
  • Preferred Communication: Families prefer in-person (73%), phone (73%), and text (64%) over email or social media.


staff-teaching-icon
Staff Feedback
  • Strong Academics: Staff praise TAG, STEM, field trips, and extended learning for boosting engagement and equity.
  • High Staff Perception of Needs: 58% report food insecurity, 57% need clothing, 53% need emotional health support for students and their families.
  • Welcoming Climate: 90% feel the school is inclusive; 73% feel supported; only 30% see consistent cultural reflection.
  • Low Leadership Awareness: Only 18% know of a parent group; 35% unsure.
  • Digital Communication Preferred: 41% use email/LMS; 49% call families; 57% rarely meet in person.  


community-neighborhood-icon

Feedback from Community Members
  • N/A  

Priorities and Opportunities

Rigorous, Community-Connected Classroom Instruction and Expanded, Enriched Learning Opportunities  
  • Strengths: TAG, STEM, and extended learning programs are widely valued and have led to academic success (e.g., Science Bowl wins).
  • Perception Alignment: Students, families, staff, and partners agree the school offers a rich, well-rounded education.
  • Equity Opportunity: Not all students feel their culture is reflected—highlighting a need to boost cultural responsiveness.
  • Access & Awareness: Ensure all students are aware of enrichment and support opportunities.
  • Opportunity: Expand TAG/STEM access, deepen community partnerships, and use regular feedback to drive inclusive, data-informed improvements. 
Collaborative Leadership, Shared Power, and Voice  
  • Student Needs: Students want peer mediation and a quiet space for reflection or prayer. 
  • Parent Leadership Gap: Only 25% of families and 18.3% of staff know of a parent group; most are unaware or unsure.
  • Engagement Disconnect: Lack of clear communication limits parent-staff collaboration and shared leadership.
  • Opportunity: Strengthen visibility and structure of parent leadership groups; actively invite and inform families.
  • Opportunity: Build inclusive practices by addressing student wellness needs and creating authentic family-staff partnerships.
Integrated Systems of Support  
  • Widespread Needs: Students (20.1%), families (24.1%), and staff (58.3%) report food, health, and emotional support needs for students and families.
  • Access Gaps: 15% across all groups lacked enough information to identify needs—indicating low awareness of services.
  • Staff Strain: Over half of staff need emotional or basic needs support, highlighting adult wellness as a priority.
  • Opportunity: Boost visibility and access to existing physical, mental, and basic needs support systems.
Culture of Belonging, Safety, and Care  
  • Welcoming Environment: Most students (83.2%), families (92%), and staff (90%) feel the school is welcoming and inclusive.
  • Communication & Support: 74.8% of students, 80%+ of families, and 73.3% of staff say school communication is clear; family events are well-attended (95.4% students, 81.7% staff).
  • Cultural Representation Gaps: Only 30% of staff and 36.8% of families feel culture is consistently reflected; 28% of students say it rarely or never is.
  • Limited Voice in Decisions: Just 18.3% of staff say students help make decisions; only 55% of families feel included in decision-making.
  • Opportunities: Strengthen culturally responsive practices and increase student and family voice in school decisions to deepen trust and equity 
Powerful Student and Family Engagement  
  • Parents prefer direct contact: Most parents favor in-person and phone calls, with text messages also popular.
  • Staff use digital most: Staff rely heavily on email and learning management systems.
  • Communication gap: There's a mismatch, as parents prefer direct methods staff use less frequently.
  • Low use for newsletters/social media: Both groups show minimal engagement with these channels.
  • Recommendation: Schools should balance digital tools (email, LMS, text) with more personal interactions (in-person, phone)